Summary – Create a Transition Matrix for Landuse Change Detection in Qgis
Instructions provided describe how to Create a Transition Matrix for Detecting changes in a Landuse of an area, Software used is Qgis and Plugin MOLUSCE, Data used is digitized from Bhuvan Landuse WMS link at Bhuvan Store all credit goes to bhuvan and Other departments, This was inspired from a awesome tutorial here by monde-geospatial .
Note : To do this analysis the MOLUSE plugin requires geotiffs equally clipped and equal cell size, otherwise you will receive error “Geometry is different for input files” so prepare data carefully by following this tutorial.
Data Required:
- Landuse datasets for two Years in Geotiff format, follow links given below if you need any help on data otherwise you can skip this part.
- For alternative data source (Geotiff format ready to download) : Decadal Land Use and Land Cover Classifications across India, 1985, 1995, 2005 by Oak Ridge National Laboratory.
- For help on data conversion (WMS Link Tutorial) : from WMS links to Shapefile GEotiff see separate tutorial here.
Three Steps:
- Prepare Data for doing this analysis.
- Load Data for Analysis.
- Generate Transition matrix using Plugin.
Procedure
1. Prepare Data for doing this analysis
Note : To do this analysis the MOLUSE plugin requires geotiffs equally clipped and equal cell size, otherwise you will receive error “Geometry is different for input files” so prepare data carefully by following this tutorial
Clip the dataset
Clip the dataset
Note : If you are using landuse shapefiles clip the shapefiles ignore this step and follow tutorial below to rasterize them.
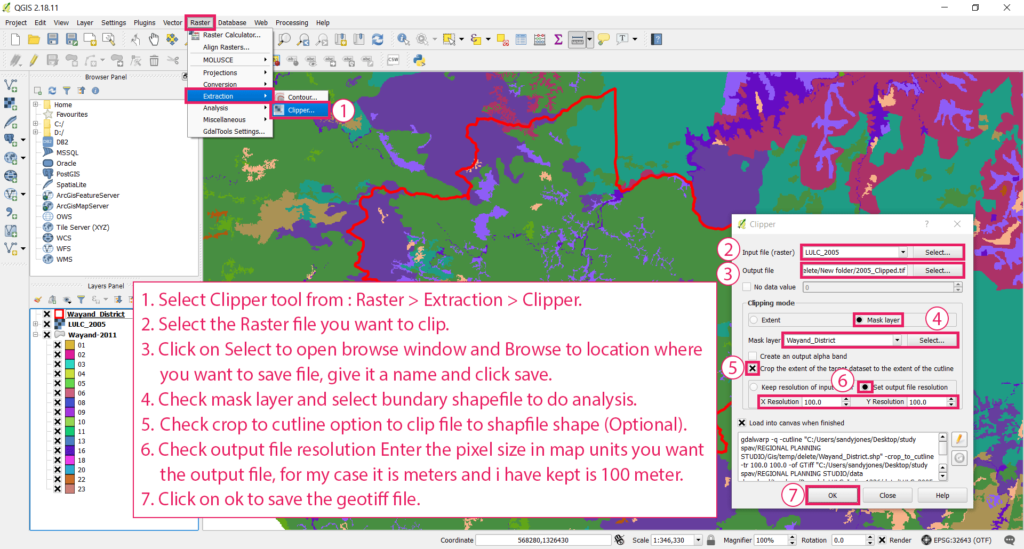
- Select Clipper tool from : Raster > Extraction > Clipper.
- Select the Raster file you want to clip.
- Click on Select to open browse window and Browse to location where you want to save file, give it a name and click save.
- Check mask layer and select bundary shapefile to do analysis.
- Check crop to cutline option to clip file to shapfile shape (Optional).
- Check Maintain clipping extent while clipping the rasters (Very Important otherwise you will get different geometry error in later steps).
- Check output file resolution Enter the pixel size in map units you want the output file, for my case it is meters and i have kept is 100 meter.
- Click on ok to save the geotiff file.
Note : If you are using landuse shapefiles clip the shapefiles ignore the above step and follow the steps given below to rasterize them.
Convert Shapefile to Raster
Convert Shapefile to Raster
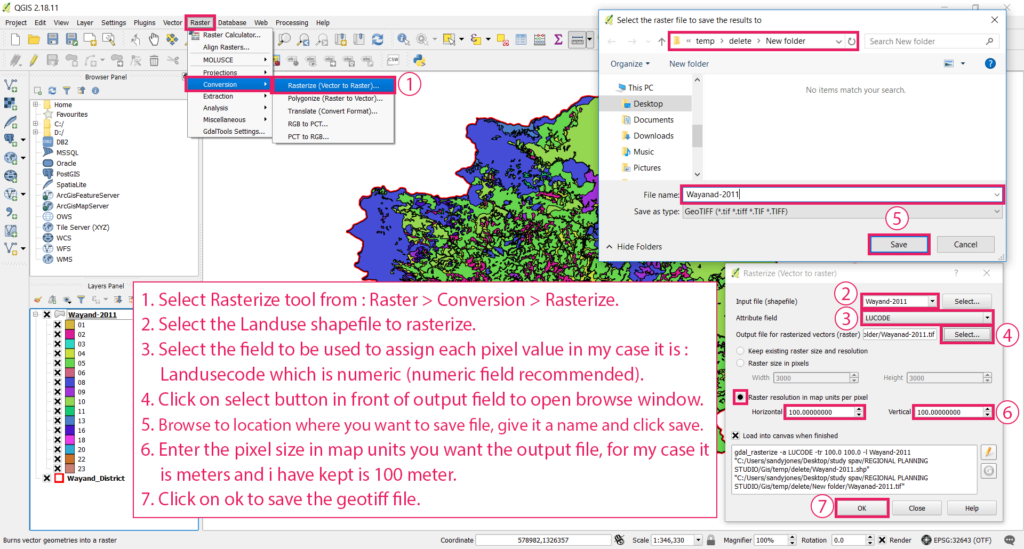
- Select Rasterize tool from : Raster > Conversion > Rasterize.
- Select the Landuse shapefile to rasterize.
- Select the field to be used to assign each pixel value in my case it is : Landusecode which is numeric (numeric field recommended).
- Click on select button in front of output field to open browse window.
- Browse to location where you want to save file, give it a name and click save.
- Enter the pixel size in map units you want the output file, for my case it is meters and i have kept is 100 meter.
- Click on ok to save the geotiff file.
2. Load Data for Analysis
Style and Label the Dataset
Style and Label the Dataset
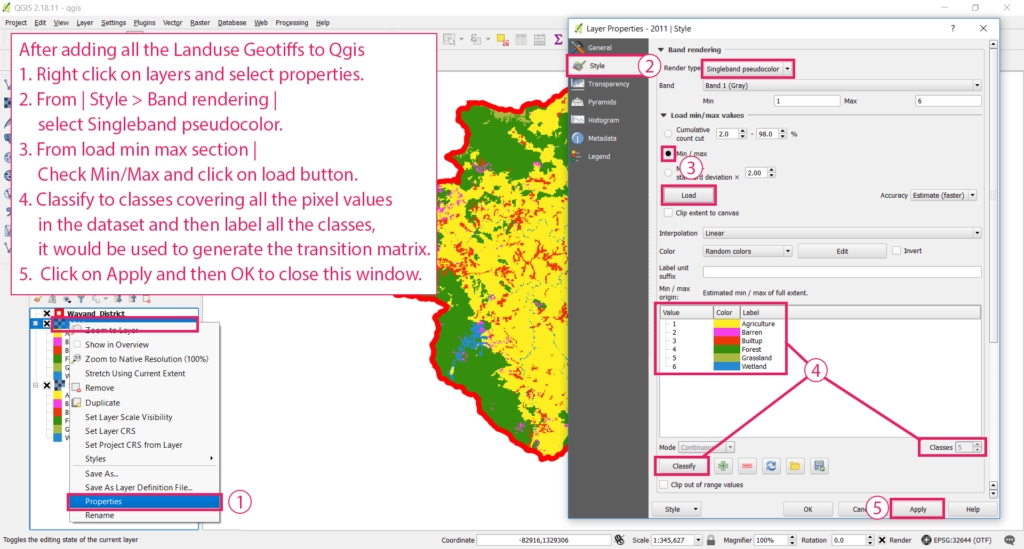
- After adding all the Landuse Geotiffs to Qgis : Right click on layers and select properties.
- From | Style > Band rendering | select Singleband pseudocolor.
- From load min max section | Check Min/Max and click on load button.
- Classify to classes covering all the pixel values in the dataset and then label all the classes, it would be used to generate the transition matrix. |
- Click on Apply and then OK to close this window.
Input the data inside Plugin
Input the data inside Plugin
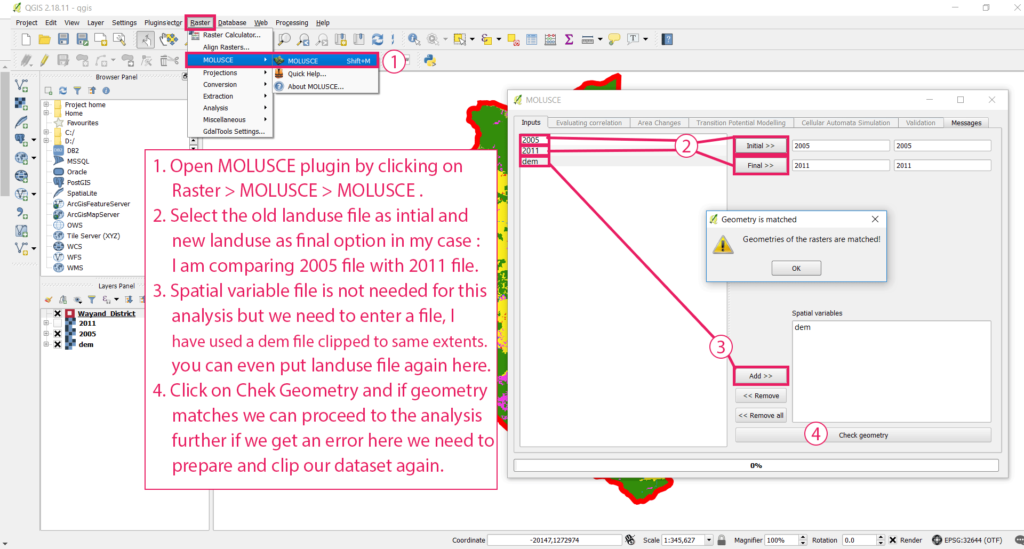
- Open MOLUSCE plugin by clicking on Raster > MOLUSCE > MOLUSCE .
- Select the old landuse file as intial and new landuse as final option in my case : I am comparing 2005 file with 2011 file.
- Spatial variable file is not needed for this analysis but we need to enter a file, I have used a dem file clipped to same extents. you can even use the landuse file again because we are not actually using it here.
- Click on Chek Geometry and if geometry matches we can proceed to the analysis further if we get an error here we need to prepare and clip our dataset again.
3. Generate Transition matrix using Plugin

Generate the transition matrix
Generate the transition matrix
- Select Area Changes tab in MOLUSCE plugin.
- Select the preffered unit from unit option menu.
- Click on update table to load transition matrix.
- Right click on matric and press CTRL + C to copy it we can paste it in excel see snap below.
- Click on create changes button to create transition map please see the screenshot below.

Changes (Transition) map
Tadda done!!
if you like the tutorial please spread the word and comment below if you have any questions.
My College submission sheet for Landuse Transition Matrix